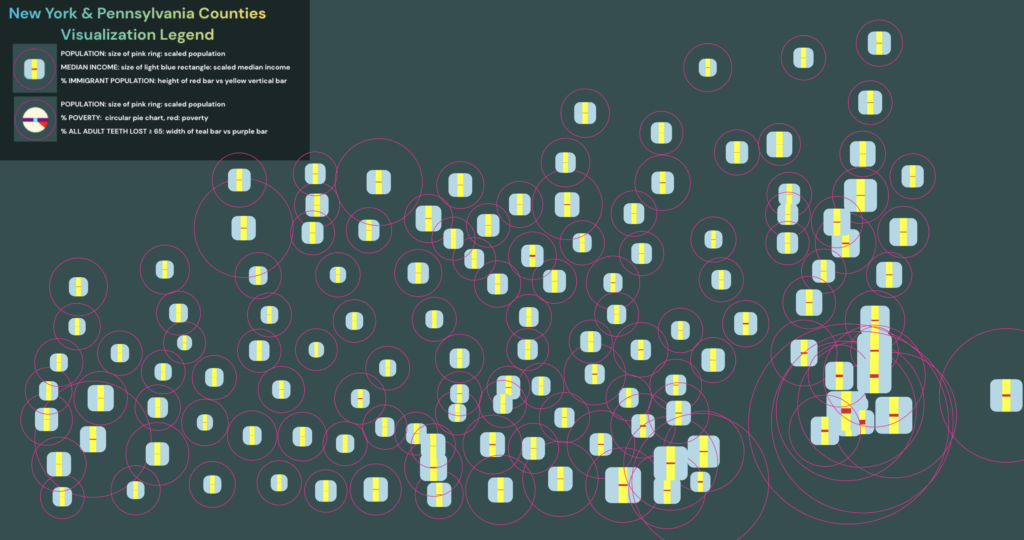
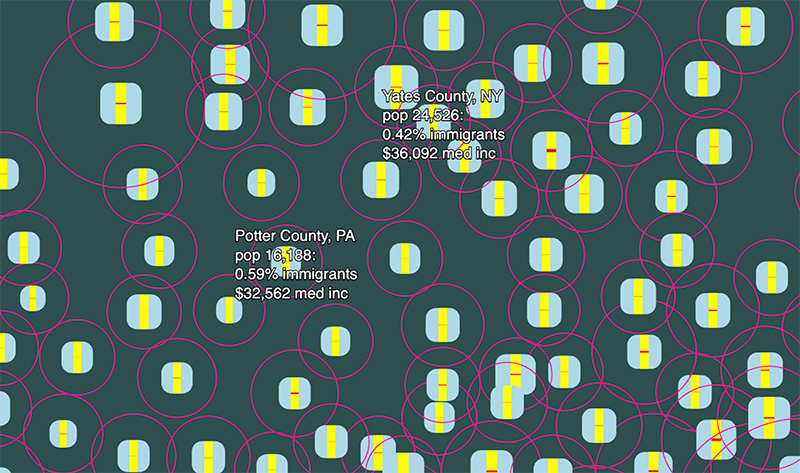
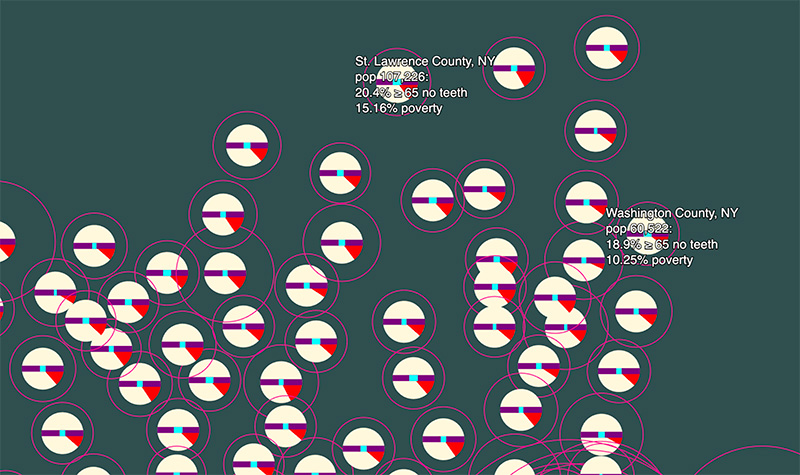
This project is an interactive visualization of census map data of NY and PA from a JSON file, displaying it through two mappings that allow you to view each county, filtering for different variables marked by shapes and charts, and allows for interaction to switch between mappings and toggle labels of county data.
This interactive experience displays all NY and PA counties as unique graphs quantifying data from the U.S. census, such as median income, total population, immigrant population, poverty, and others. HTML is used to provide filtering options for displaying counties and options for graphs that quantify different data.